© 2018. All rights reserved.
I have just started visualizing surface measures such as cortical thicknesses produced by Freesurfer. To that end, I needed to learn how to produce surface renderings using tksurfer on an industrial scale. To do that using tksurfer needed me to write a Tcl script (a language that I did not existed until yesterday). It is quite a fun language but using it I can generate figures for multiple datasets by the following command:
$> tksurfer fsaverage lh inflated -tcl tksurfer_save_abs_rel_thickness_figs.tcl -curv lh.sulc -colscalebarflag 1
This calls tksurfer with the tcl script.
The tclscript looks like following:

set base_dir  my_base_dir
set meas some_suffix_i_came_up_with
set out_suffix_lateral _lateral.tiff
set out_suffix_medial _medial.tiff

set overlayflag 1


set colscalebarfig 1

set forcegraycurvatureflag 1
set gaLinkedVars(colscale) 1
foreach scanner { A B C D E F G H } {

	set file_name $base_dir$scanner/$scanner$meas.mgh
	set out_lateral $base_dir$scanner/$scanner$meas$out_suffix_lateral
	set out_medial $base_dir$scanner/$scanner$meas$out_suffix_medial
	puts $file_name
	puts $out_lateral
	puts $out_medial
	set val $file_name
	sclv_read_from_dotw 0

	set gaLinkedVars(fopaqueflag) 0
	set gaLinkedVars(fthresh) 5.0
	set gaLinkedVars(fmid) 20.0
	set gaLinkedVars(fslope) 1
	set gaLinkedVars(truncphaseflag) 1

	SendLinkedVarGroup overlay


	set gaLinkedVars(colscalebarfig) 1
	SendLinkedVarGroup view

	redraw
	set colscalebarfig 1
	redraw

	save_tiff ${out_lateral}

	rotate_brain_y 180
	redraw
	save_tiff ${out_medial}
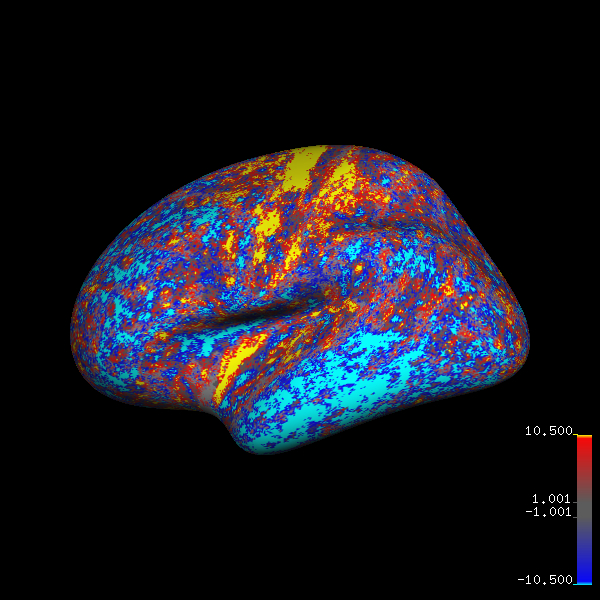
And I am able to generate figures like below for multiple datasets at a keystroke. Since I need to generate these figures on a regular basis, it should be worth the time it took to learn Tcl and changing the different variables to get the figure I wanted.
fsaverage brain with thickness differences:
